Menu
Data Visualisation Using Power BI
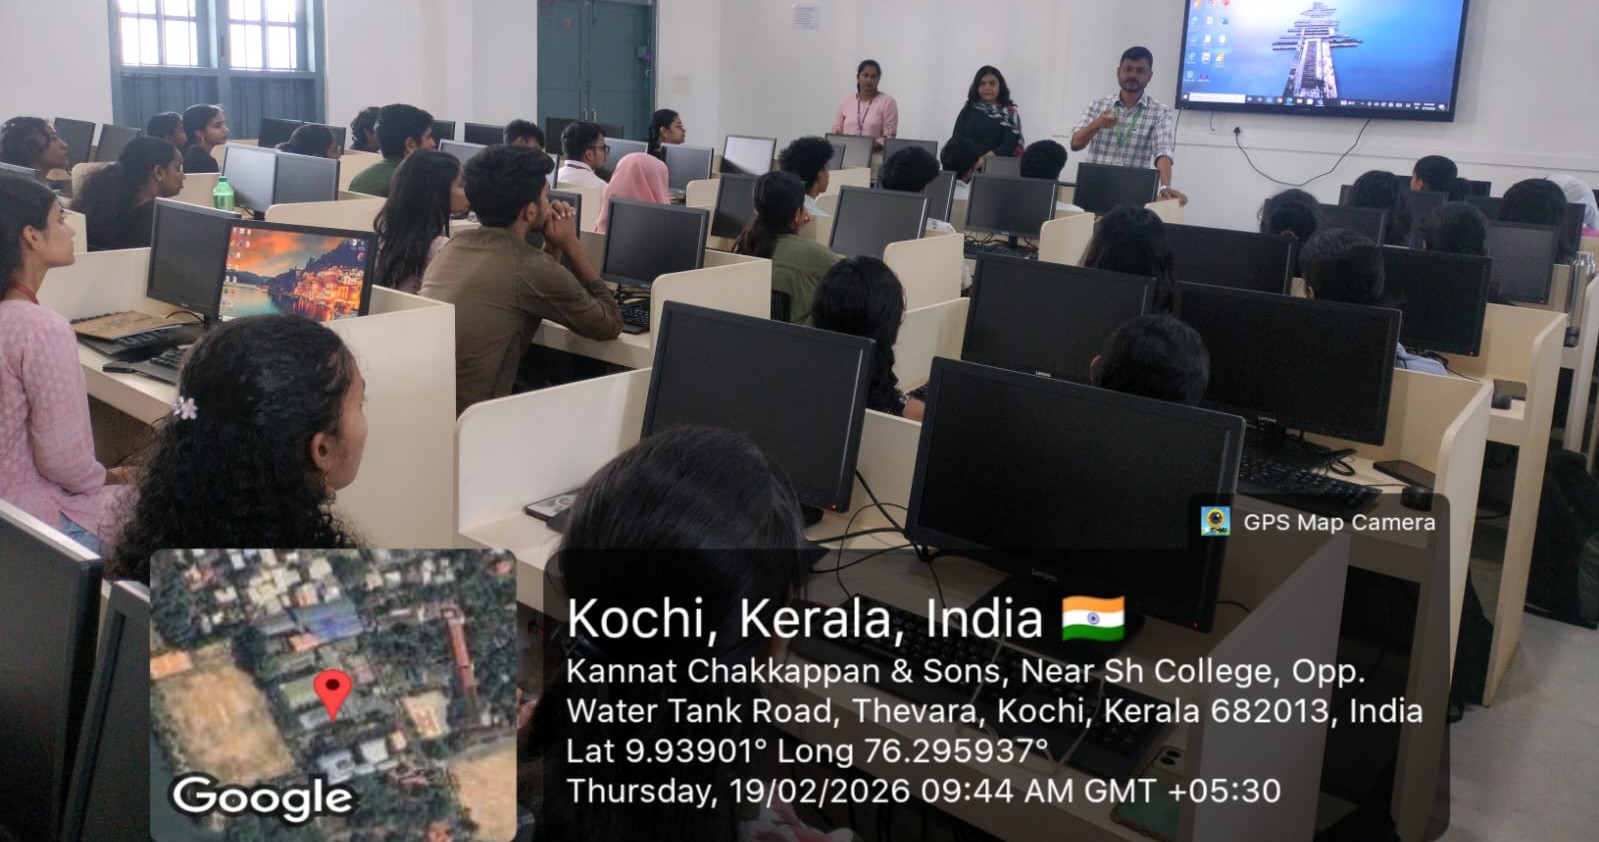
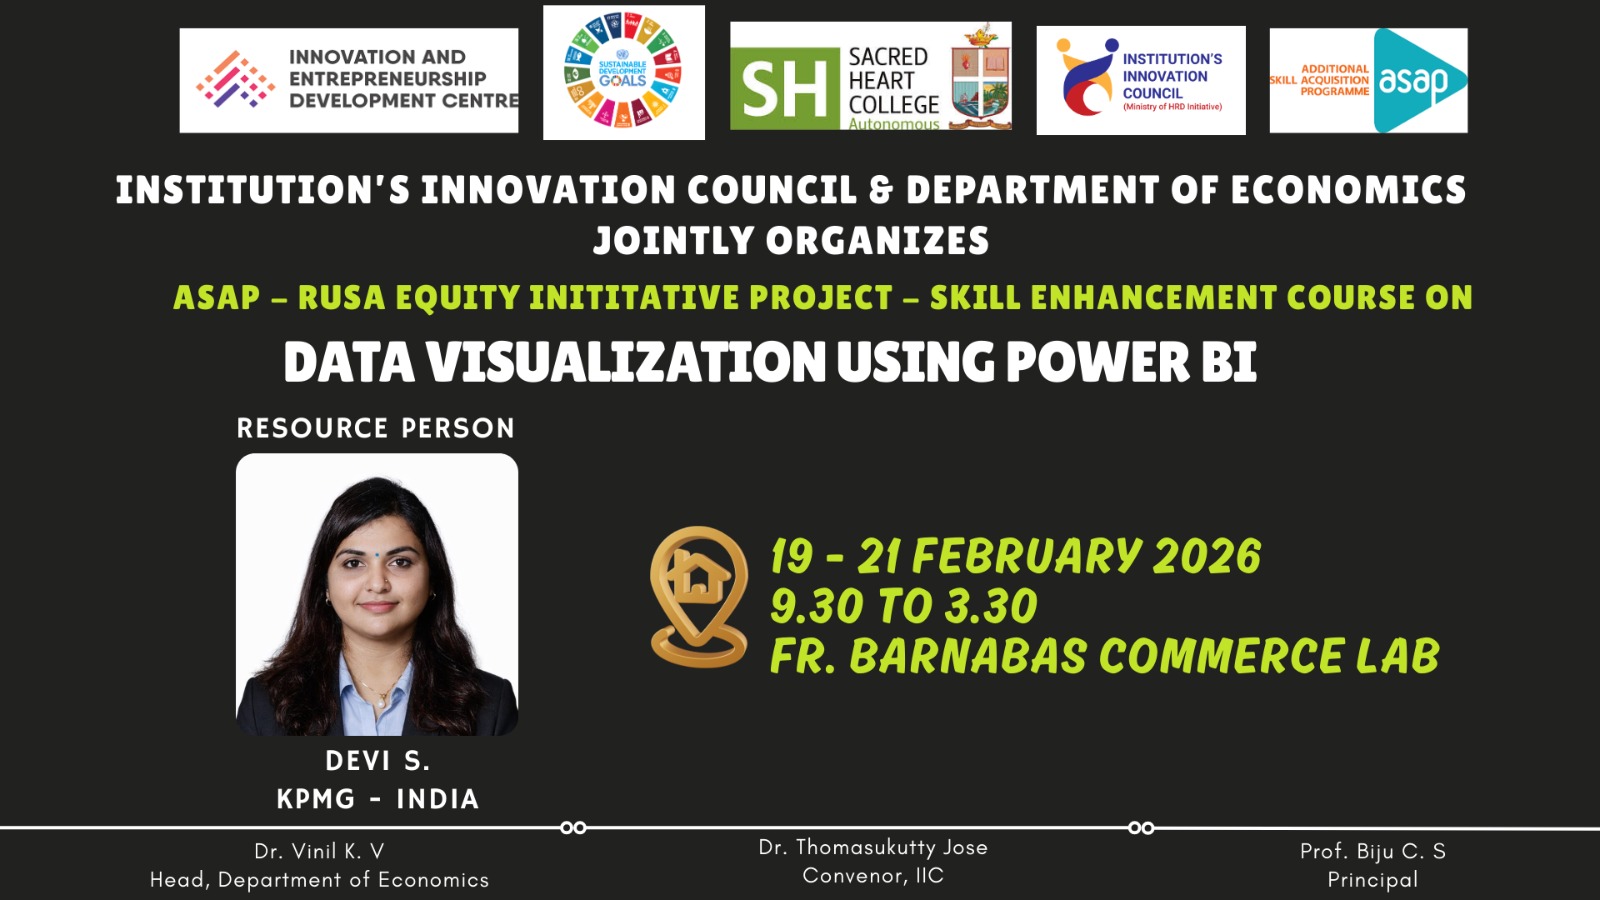
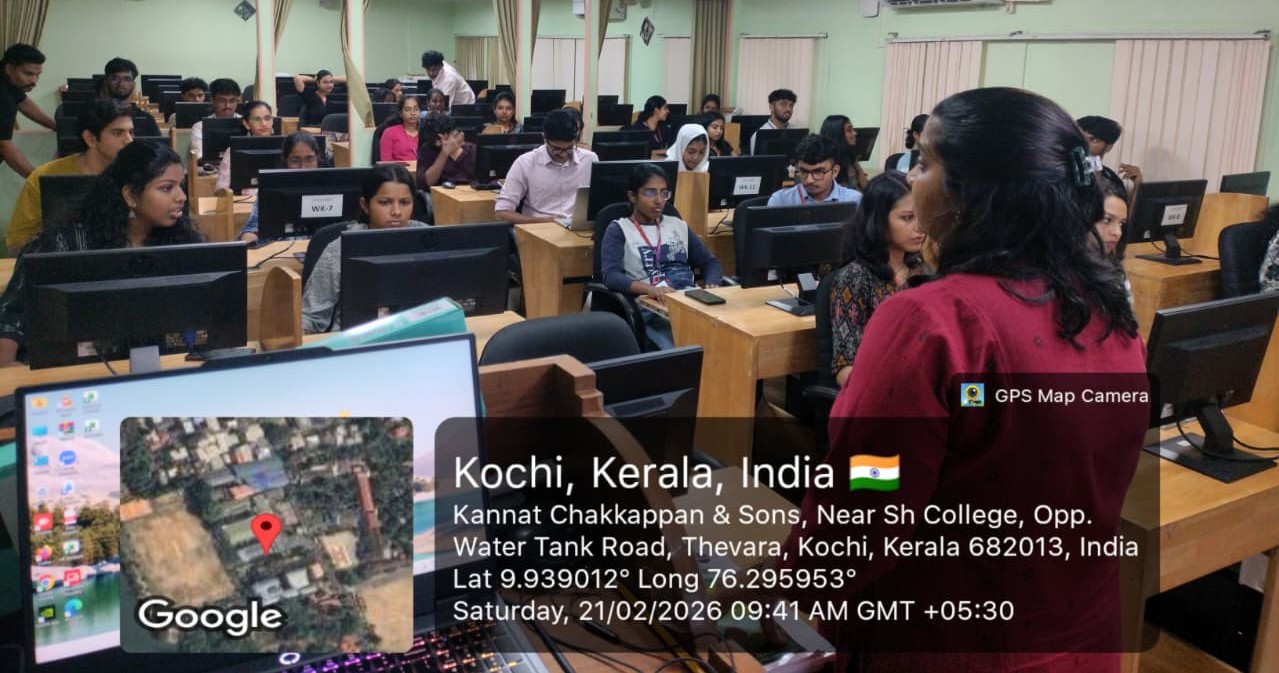
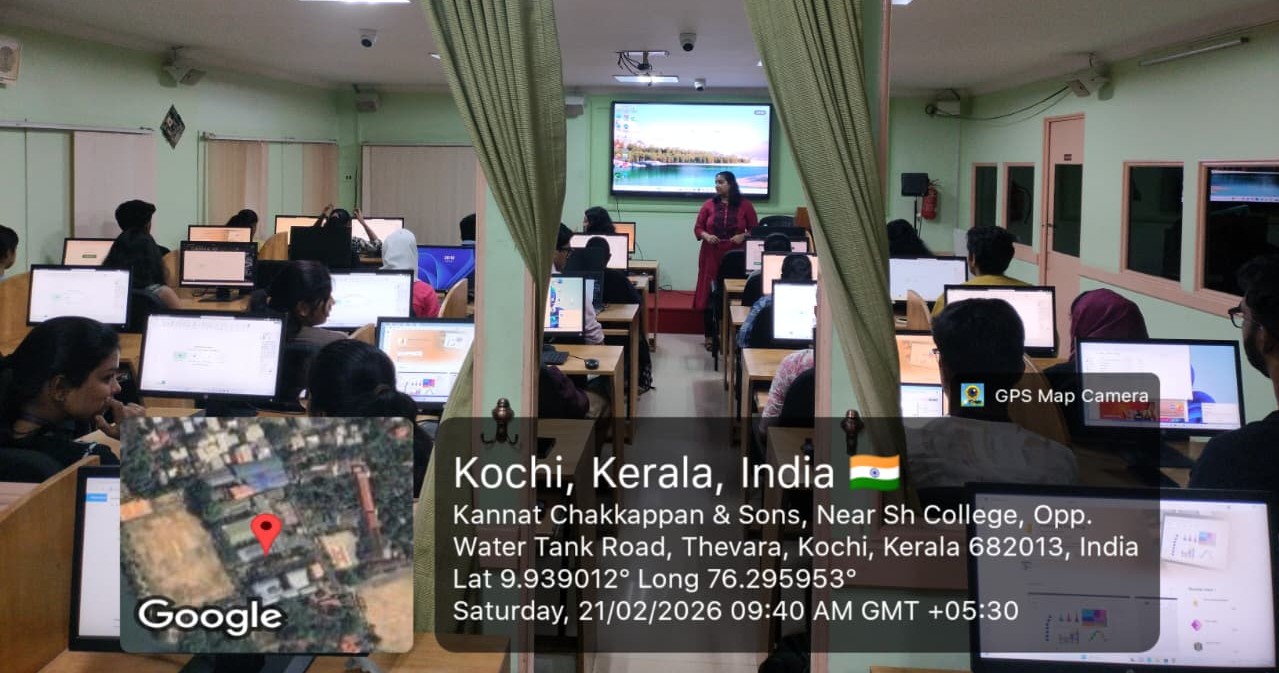
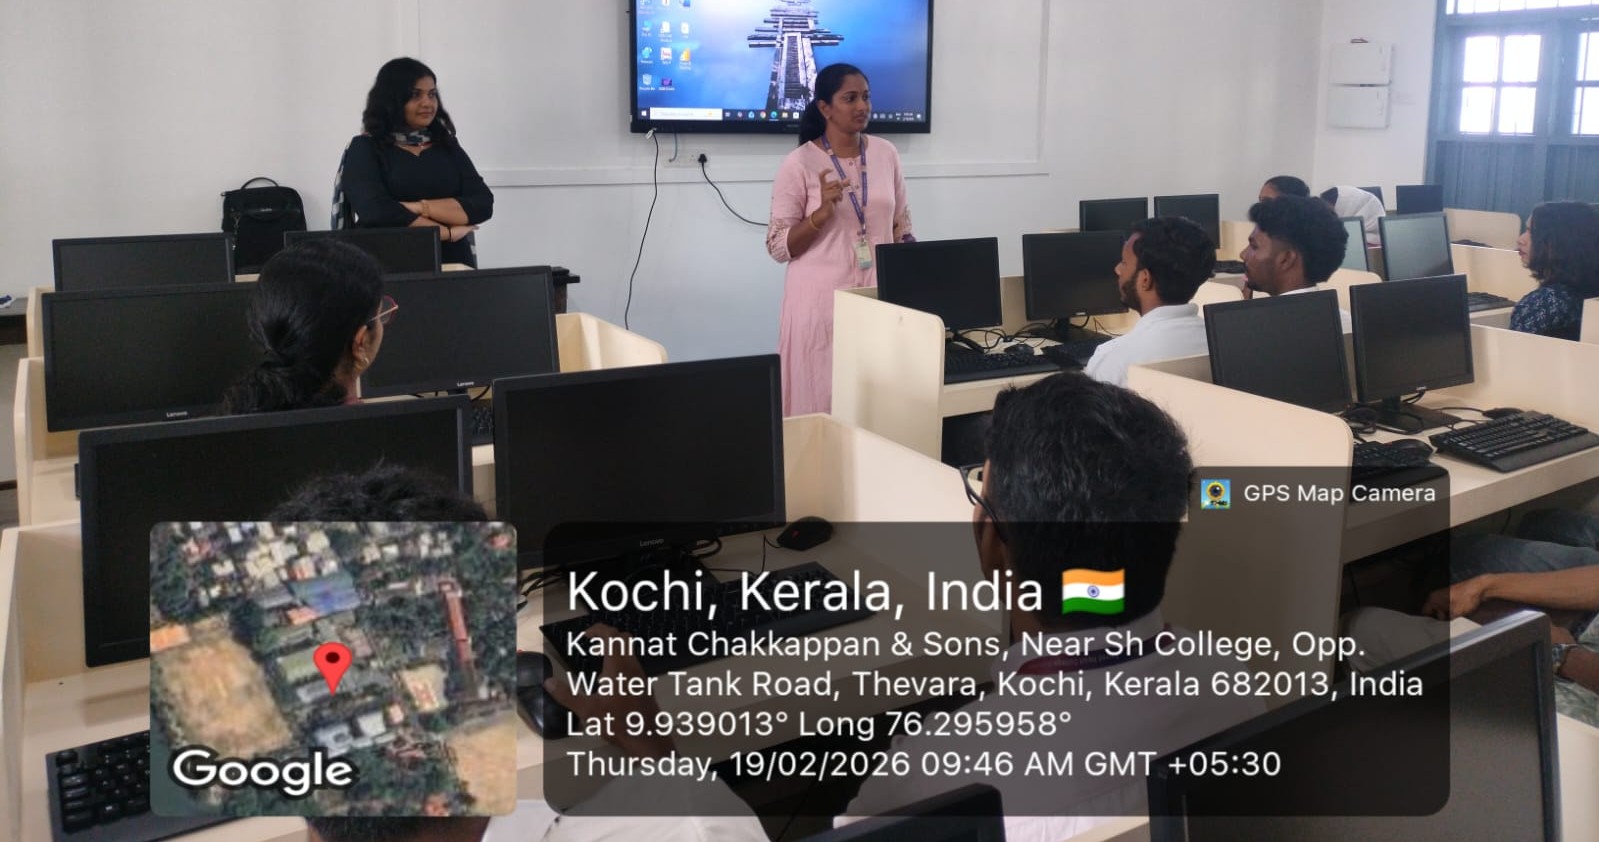
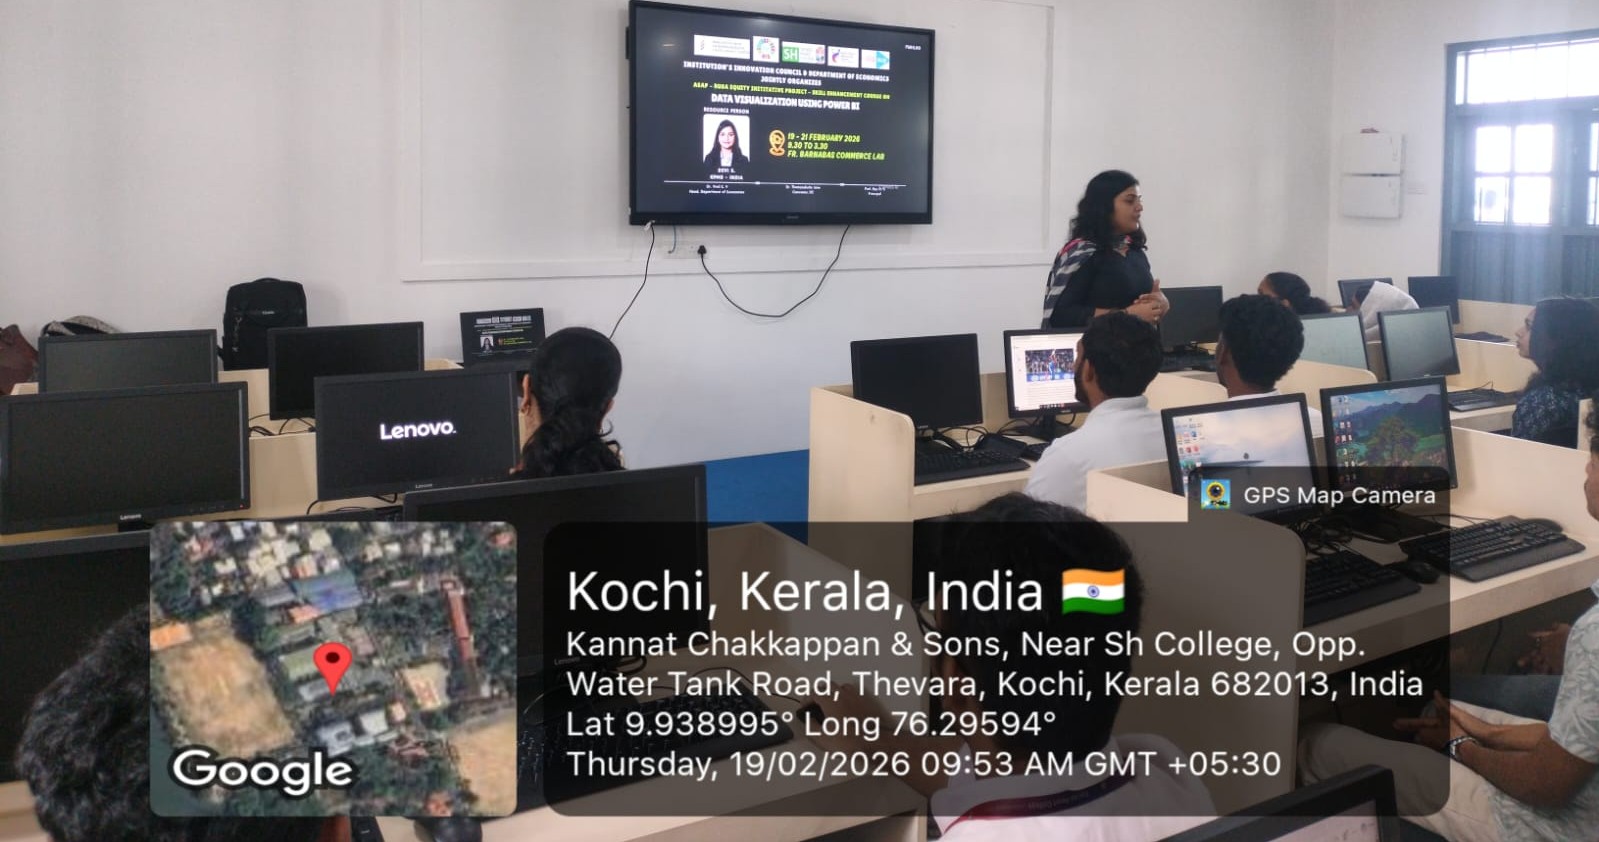
The Institution’s Innovation Council and the Department of Economics conducted a three-day skill enhancement course on “Data Visualisation Using Power BI” from 19 to 21 February 2026 at the Fr Barnabas Commerce Lab. The programme, led by industry experts from KPMG under the ASAP–RUSA Equity Initiative, trained 40 students in practical business intelligence and interactive dashboard design.
Gallery
bi1

bi2
bi3
bi4
bi5
bi6